Last updated on September 22nd, 2024 at 06:22 am
Ever since Search Console API came into the picture there have been so many brilliant applications of it.
Once you combine GSC API with Python the amount of data that you can extract, manipulate & visualize is simply incredible.
In this post, I will explain how you can visualize Search Console URLs data with Month of Month Clicks data so that you can understand the Decay or Progression that is taking place.
Honourable mention to Mihir Naik this script is almost entirely based on his Git, the only addition is Page Level data extraction instead of Query, Page and another addition is the fact that you get to see MoM visualization of URL Clicks.
P.S. If you are unfamiliar with how to authenticate GSC via Google Cloud then watch this video by Mihir first.
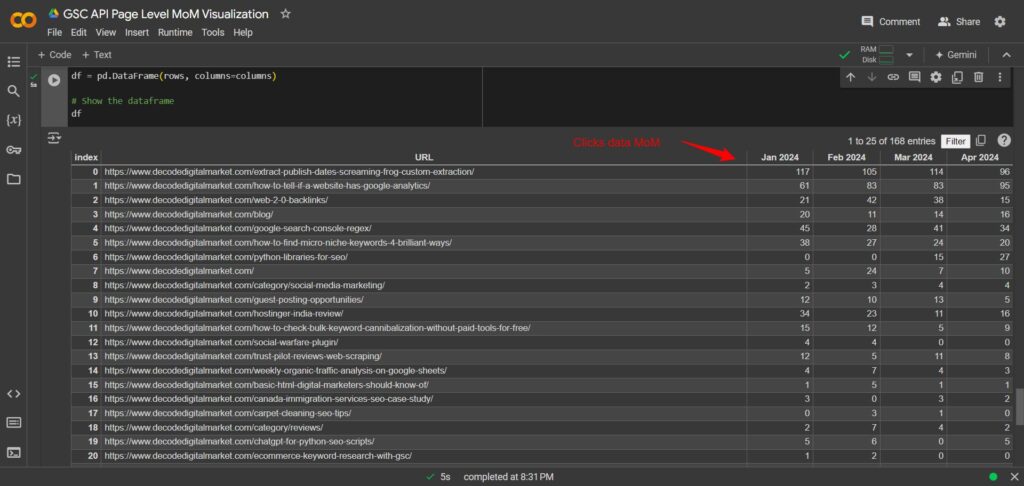
In the end, you would be able to visualize MoM URL Clicks data like the screenshot below

Here is the Google Colab Notebook Code Blocks
1st Code Block: Installations
					# Install required python packages
!pip install oauth2client
!pip install google-api-python-client
!pip install httplib2
2nd Code Block
					# Import required packages
from oauth2client.client import OAuth2WebServerFlow
from googleapiclient.discovery import build
import httplib2

# Google Cloud Project Client ID & Client Secrets
CLIENT_ID = "secret.apps.googleusercontent.com"
CLIENT_SECRET = "secret-add-your-own"
OAUTH_SCOPE = "https://www.googleapis.com/auth/webmasters.readonly"
REDIRECT_URI = 'urn:ietf:wg:oauth:2.0:oob'
flow = OAuth2WebServerFlow(CLIENT_ID, CLIENT_SECRET, OAUTH_SCOPE, REDIRECT_URI)
authorize_url = flow.step1_get_authorize_url()
print("Go to the following link in your browser: " + authorize_url)
auth_code = input("Enter your Authorization Code here:")
credentials = flow.step2_exchange(auth_code)
http = httplib2.Http()
creds = credentials.authorize(http)
webmasters_service = build('searchconsole', 'v1', http=creds)
3rd Code Block
					# Get a list of site in my Google Search Console Account
site_list = webmasters_service.sites().list().execute()
site_list
After this above code block it will print the list of search console properties you have in that account & in the next code block choose the one for which you want visualization.
4th Code Block
					# the website we want to get the data for
website = "sc-domain:decodedigitalmarket.com"

# build a request body
request_body = {
    "startDate"	: '2024-01-01',
    "endDate" : '2024-02-30',
    "dimensions" : ['PAGE'],
    "rowLimit" : 25000,
    "dataState" : "final"
}

# get the response using request body
response_data = webmasters_service.searchanalytics().query(siteUrl=website, body=request_body).execute()
5th Code Block
len(response_data['rows'])
6th Code Block
					# create an empty list to store the rows from response
all_responses = []

# define a startRow
startRow = 0

while (startRow == 0) or (startRow%25000 == 0):
  # build a request body
  request_body = {
      "startDate"	: '2024-01-01',
      "endDate" : '2024-02-30',
      "dimensions" : ['PAGE'],
      "rowLimit" : 25000,
      "dataState" : "final",
      'startRow' : startRow
      }

  #get gsc response
  response_data = webmasters_service.searchanalytics().query(siteUrl=website, body=request_body).execute()

  #update the rows
  startRow = startRow + len(response_data['rows'])
  print("fetched up to " + str(startRow) + " rows of data")

  # for loop tos save all the rows in all_responses
  for row in response_data['rows']:
    all_responses.append(row)
7th Code Block
len(all_responses)
8th Code Block
all_responses[0]
9th Code Block
import pandas as pd
10th Code Block
					#empty list to build a dataframe
data_for_df = []

for each in all_responses:

  temp = []

  #page
  temp.append(each['keys'][0])

  #clicks
  temp.append(each['clicks'])

  #impressions
  temp.append(each['impressions'])

  #ctr
  temp.append(each['ctr'])

  #position
  temp.append(each['position'])

  data_for_df.append(temp)
11th Code Block
data_for_df[0]
12th Code Block
df = pd.DataFrame(data_for_df, columns=['page', 'clicks', 'impressions', 'ctr', 'position'])
df
13th Code Block
					# build a request body to include date dimension
request_body = {
    "startDate": '2024-01-01',
    "endDate": '2024-04-30',
    "dimensions": ['PAGE', 'DATE'],
    "rowLimit": 25000,
    "dataState": "final"
}

# create an empty list to store the rows from response
all_responses = []

# define a startRow
startRow = 0

while (startRow == 0) or (startRow % 25000 == 0):
    # get GSC response
    response_data = webmasters_service.searchanalytics().query(siteUrl=website, body=request_body).execute()

    # update the rows
    startRow = startRow + len(response_data['rows'])
    print("fetched up to " + str(startRow) + " rows of data")

    # for loop to save all the rows in all_responses
    for row in response_data['rows']:
        all_responses.append(row)
14th Code Block
					import pandas as pd

# Dictionary to collect clicks data by URL and month-year
url_clicks = {}

for each in all_responses:
    url = each['keys'][0]
    date = each['keys'][1]
    clicks = each['clicks']

    month_year = pd.to_datetime(date).strftime('%b %Y')  # Convert to 'MMM YYYY' format

    if url not in url_clicks:
        url_clicks[url] = {}

    if month_year not in url_clicks[url]:
        url_clicks[url][month_year] = 0

    url_clicks[url][month_year] += clicks

# Collect all unique month-year pairs to define the columns dynamically
all_month_years = sorted({month_year for clicks in url_clicks.values() for month_year in clicks.keys()}, key=lambda x: pd.to_datetime(x))

# Create the final dataframe
rows = []
for url, clicks_data in url_clicks.items():
    row = [url]
    for month_year in all_month_years:
        row.append(clicks_data.get(month_year, 0))  # Append click data or 0 if not available
    rows.append(row)

# Create column names dynamically
columns = ['URL'] + all_month_years

df = pd.DataFrame(rows, columns=columns)

# Show the dataframe
df
After executing this code block you can see URLs Clicks Data visualized on a MoM basis.

Kunjal Chawhan founder of Decode Digital Market, a Digital Marketer by profession, and a Digital Marketing Niche Blogger by passion, here to share my knowledge

