In this post, I will explain how to use GSC (Google Search Console) API with Python Script to identify the outliers in Search Impressions & Search Clicks data.
Outliers here means Anomalies in the data. i.e. query you received impressions or clicks for unusally.
Let’s say there are X number of queries you receive clicks or impressions for mimicking the expected behaviour but all of sudden you’re finding unexpected queries for which you’re receiving impressions or clicks.
We will be leveraging K-Means Clustering which is a Python Library and a Machine Learning Algorithm built for Anomally detection.
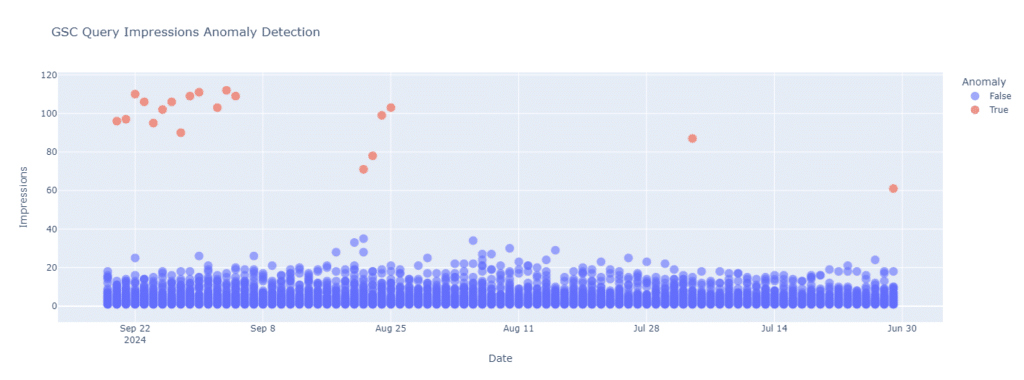
Below Screenshot shows how the outcome looks like

The above screenshot distinguishes queries on the TRUE & FALSE cluster. True being the anomaly. This is on the Impressions level.
Here is the step by step Google Colab Python Script
Step 1 – Installations
					# Install required python packages
!pip install oauth2client
!pip install google-api-python-client
!pip install httplib2
!pip install kmeans
!pip install scikit-learn
!pip install plotly
Step 2 – Imports & specifying your GSC API Credentials
					# Import required packages
from oauth2client.client import OAuth2WebServerFlow
from googleapiclient.discovery import build
import httplib2

# Google Cloud Project Client ID & Client Secrets
CLIENT_ID = "your_secret.apps.googleusercontent.com"
CLIENT_SECRET = "your_secret"
OAUTH_SCOPE = "https://www.googleapis.com/auth/webmasters.readonly"
REDIRECT_URI = 'urn:ietf:wg:oauth:2.0:oob'
flow = OAuth2WebServerFlow(CLIENT_ID, CLIENT_SECRET, OAUTH_SCOPE, REDIRECT_URI)
authorize_url = flow.step1_get_authorize_url()
print("Go to the following link in your browser: " + authorize_url)
auth_code = input("Enter your Authorization Code here:")
credentials = flow.step2_exchange(auth_code)
http = httplib2.Http()
creds = credentials.authorize(http)
webmasters_service = build('searchconsole', 'v1', http=creds)
Step 3 – Getting the GSC Property Site List
					# Get a list of site in my Google Search Console Account
site_list = webmasters_service.sites().list().execute()

site_list
Step 4 – Fetch Data from GSC API for your Property for Query & Date Parameter
					# Fetch data from Google Search Console
def fetch_gsc_data(site_url, start_date, end_date, dimensions=['query', 'date']):
    request = {
        'startDate': start_date,
        'endDate': end_date,
        'dimensions': dimensions,
        'rowLimit': 25000  # Adjust based on the number of queries you have
    }
    response = webmasters_service.searchanalytics().query(siteUrl=site_url, body=request).execute()
    return response['rows']

# Example usage
site_url = 'sc-domain:decodedigitalmarket.com'  # Replace with your actual site URL
start_date = '2024-07-01'
end_date = '2024-09-26'
gsc_data = fetch_gsc_data(site_url, start_date, end_date)

# Display some data
for row in gsc_data[:5]:
    print(row)
Step 5 – Manipulate the Data for Visualization
					import pandas as pd
from sklearn.cluster import KMeans
import numpy as np

# Process data and convert it into a DataFrame
def process_gsc_data(gsc_data, exclude_queries=None):
    exclude_queries = exclude_queries or []
    data = []
    for row in gsc_data:
        query = row['keys'][0]
        date = row['keys'][1]
        impressions = row['impressions']

        if any(ex_query in query for ex_query in exclude_queries):
            continue

        data.append([query, date, impressions])

    df = pd.DataFrame(data, columns=['Query', 'Date', 'Impressions'])
    df['Date'] = pd.to_datetime(df['Date'])
    return df

exclude_queries = ['exclude_queries', 'exclude_queries','exclude_queries']  # Add the queries you want to exclude
df = process_gsc_data(gsc_data, exclude_queries)

# Identify anomalies using k-means clustering
def identify_anomalies(df, n_clusters=2):
    df['Impressions_zscore'] = (df['Impressions'] - df['Impressions'].mean()) / df['Impressions'].std()
    kmeans = KMeans(n_clusters=n_clusters)
    df['Cluster'] = kmeans.fit_predict(df[['Impressions_zscore']])
    anomaly_cluster = df.groupby('Cluster')['Impressions'].mean().idxmax()  # Assuming the cluster with the highest mean impressions is anomalies
    df['Anomaly'] = df['Cluster'] == anomaly_cluster
    return df

df_anomalies = identify_anomalies(df)

# Display some anomalies
print(df_anomalies[df_anomalies['Anomaly']].head())
Step 6 – Visualize the Anomalies on Impressions Level
					import plotly.express as px

# Visualize anomalies with descending date order
def visualize_anomalies(df):
    fig = px.scatter(
        df,
        x='Date',
        y='Impressions',
        color='Anomaly',
        hover_data=['Query', 'Impressions'],
        title='GSC Query Impressions Anomaly Detection'
    )
    fig.update_traces(marker=dict(size=12, opacity=0.6), selector=dict(mode='markers'))
    fig.update_xaxes(autorange='reversed')  # Reverse the x-axis
    fig.show()

visualize_anomalies(df_anomalies)
Want to visualize Anomalies on the Clicks Level? Here are the next code blocks for that
Step 7 – Fetch GSC Data with Clicks Parameter this time
					# Fetch data from Google Search Console
def fetch_gsc_data_clicks(site_url, start_date, end_date, dimensions=['query', 'date']):
    request = {
        'startDate': start_date,
        'endDate': end_date,
        'dimensions': dimensions,
        'rowLimit': 25000  # Adjust based on the number of queries you have
    }
    response = webmasters_service.searchanalytics().query(siteUrl=site_url, body=request).execute()
    return response['rows']

# Example usage
site_url = 'sc-domain:decodedigitalmarket.com'  # Replace with your actual site URL
start_date = '2024-04-01'
end_date = '2024-06-30'
gsc_data_clicks = fetch_gsc_data_clicks(site_url, start_date, end_date)

# Display some data
for row in gsc_data_clicks[:5]:
    print(row)
Step 8 – Process Data to have it in Data Frame for Visualization
					import pandas as pd
from sklearn.cluster import KMeans
import numpy as np

# Process data and convert it into a DataFrame
def process_gsc_data_clicks(gsc_data, exclude_queries=None):
    exclude_queries = exclude_queries or []
    data = []
    for row in gsc_data:
        query = row['keys'][0]
        date = row['keys'][1]
        clicks = row['clicks']

        if clicks <= 0:
            continue

        if any(ex_query in query for ex_query in exclude_queries):
            continue

        data.append([query, date, clicks])

    df = pd.DataFrame(data, columns=['Query', 'Date', 'Clicks'])
    df['Date'] = pd.to_datetime(df['Date'])
    return df

exclude_queries = ['exclude1', 'exclude2']  # Add the queries you want to exclude
df_clicks = process_gsc_data_clicks(gsc_data_clicks, exclude_queries)

# Identify anomalies using k-means clustering
def identify_anomalies_clicks(df, n_clusters=2):
    df['Clicks_zscore'] = (df['Clicks'] - df['Clicks'].mean()) / df['Clicks'].std()
    kmeans = KMeans(n_clusters=n_clusters)
    df['Cluster'] = kmeans.fit_predict(df[['Clicks_zscore']])
    anomaly_cluster = df.groupby('Cluster')['Clicks'].mean().idxmax()  # Assuming the cluster with the highest mean clicks is anomalies
    df['Anomaly'] = df['Cluster'] == anomaly_cluster
    return df

df_anomalies_clicks = identify_anomalies_clicks(df_clicks)

# Display some anomalies
print(df_anomalies_clicks[df_anomalies_clicks['Anomaly']].head())
Step 9 – Visualize Clicks Anomally
					import plotly.express as px

# Visualize anomalies
def visualize_anomalies_clicks(df):
    fig = px.scatter(
        df,
        x='Date',
        y='Clicks',
        color='Anomaly',
        hover_data=['Query', 'Clicks'],
        title='GSC Query Clicks Anomaly Detection'
    )
    fig.update_traces(marker=dict(size=12, opacity=0.6), selector=dict(mode='markers'))
    fig.show()

visualize_anomalies_clicks(df_anomalies_clicks)
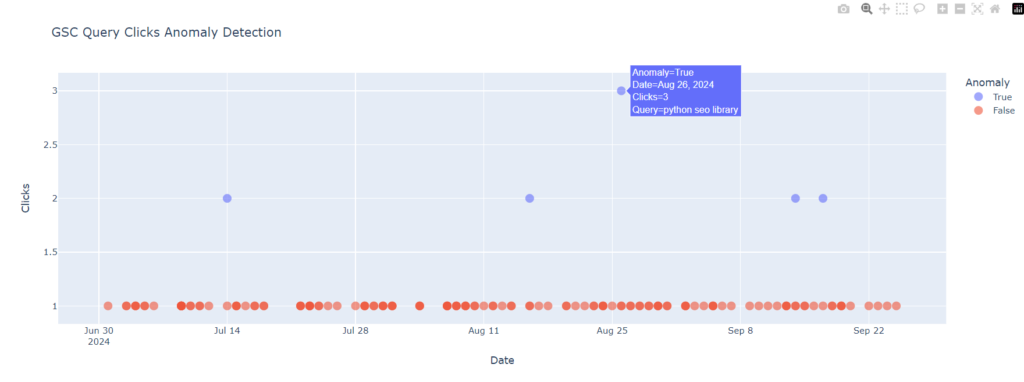
This is how Clicks Level Anomally looks like

Probable Use Cases:
- There is sudden turbulence, with this script you can easily isolate the anomalies to get closer to the source of the truth
- You launched a new content cluster, with this process you can see them progressing towards anomalies & later turning into usual expected behaviour that journey can be measured and tapped.
- There was an algorithm update, you can measure whether the algorithm update the usual pattern into anomalies by decemating certain clusters.

Kunjal Chawhan founder of Decode Digital Market, a Digital Marketer by profession, and a Digital Marketing Niche Blogger by passion, here to share my knowledge

